How to Compare Content Performance by Persona (And Stop Optimizing for the Average)
Comparing content performance by persona means segmenting your content analytics by buyer type, such as economic buyer, technical evaluator, or end-user champion, so you can see which assets resonate with each audience rather than averaging engagement across all of them. It requires persona-tagged content, persona-mapped engagement metrics, and a feedback loop that connects content performance back to deal outcomes for each buyer type.
Your quarterly content review shows a case study performing well. Average time-on-page is solid. Share rate is decent. The team is satisfied. But look closer: the asset is almost exclusively being shared with procurement contacts, and it's converting nothing. Meanwhile, a technical deep-dive one-pager that barely registers in the aggregate is appearing in every closed-won deal where an IT Director was involved. The aggregate metric lied. The persona-level view told the truth.
Most content teams measure performance as if all buyers are the same person. They're not. A CFO reading your pricing comparison has entirely different goals, concerns, and content preferences than the engineer evaluating your integration docs or the VP of Sales building the internal business case before quarter-end. When you measure content performance as an aggregate, you optimize for the average. The average doesn't close deals. This guide covers how to compare content performance by persona, which metrics matter most at each buyer type, and how to connect that analysis to sales outcomes rather than stopping at page views.
Understanding this starts with knowing what content tracking actually measures and where the standard view breaks down.
What Does Comparing Content Performance by Persona Actually Mean?
The difference between content performance by persona and overall content performance is not a reporting style preference. It's the difference between knowing a case study is working and knowing who it's working for, at what stage, and what happens next when that specific buyer type engages with it.
Overall content performance measures how an asset performs across all viewers combined. Persona-based content performance segments those same metrics by buyer type. The aggregate view is useful for spotting outlier performers and failures. The persona view is where decisions get made: which asset should a rep send to a CFO versus an engineer versus a procurement contact?
The reason the distinction matters is structural. Gartner data shows the average B2B buying group involves six to ten stakeholders. Content that lands with a technical evaluator can actively repel an economic buyer. A case study packed with implementation detail reassures an IT Director and bores a CFO who needed to see the ROI framing on slide two. Optimizing from aggregate metrics produces content that's mildly acceptable to everyone and deeply resonant with no one.
The Three Persona Dimensions Most Useful for Content Performance Comparison
- Role-based personas: CXO/VP (economic buyer), Director/Manager (champion), Practitioner/Engineer (technical evaluator), Procurement (gatekeeper). This is the primary dimension for most B2B sales content analysis.
- Vertical personas: Content that resonates in FinTech differs from what lands in Enterprise SaaS or HealthTech, even for the same role. Vertical tagging enables the next layer of comparison once role-based analysis is established.
- Deal stage personas: An awareness-stage reader and a decision-stage reader occupy the same job title but have entirely different information needs. Tracking which persona type engages with which content at which stage reveals whether your library serves the full buying journey or clusters at one end of it.
See also: Organize B2B Marketing Content in 8 Simple Steps for how to structure a library that makes persona-level filtering possible in the first place.
Step One: Tagging Your Content for Persona-Based Analysis
Tag content for persona-based tracking by building a three-dimensional taxonomy: primary persona target (who the asset is for), funnel stage (awareness, consideration, decision), and vertical fit (general or industry-specific). Apply tags before content enters the library and track contact-level engagement data separately to see whether the actual audience matches the intended one.
You cannot compare performance by persona if your content isn't tagged by persona. Most content teams tag by format (case study, one-pager, demo video). That's a start, but format tags answer a different question than persona tags. Format tags tell you what types of assets work. Persona tags tell you who they work for. Both are necessary; only one enables the analysis in this guide.
Build Your Persona Tagging Taxonomy First
Before tagging a single asset, define your tagging dimensions. Adding tags after the fact produces inconsistent data and makes filtering unreliable. The three tags every B2B content team needs:
- Primary persona target: Who is this asset primarily designed to be shared with? (VP Sales, IT Director, CFO, End User, Procurement Contact) This is the most important tag for persona performance comparison.
- Funnel stage: What stage of the buyer journey does this asset serve? (Awareness, Consideration, Decision) This tag enables stage-by-persona analysis, the most revealing combination.
- Vertical fit: Is this asset general-purpose or industry-specific? (General, FinTech, HealthTech, Enterprise SaaS, Manufacturing) Add this once role-based tagging is established and you have enough assets per vertical to make the comparison meaningful.
Tags not used in reporting decisions shouldn't exist. Every tag you create adds taxonomy complexity without analytical payoff if it never appears in a filter or a comparison report.
Tag at Asset Level and Track at Contact Level
The asset tag defines the intended audience. Contact-level engagement data tells you who actually consumed it. When these diverge consistently, for example, when an asset tagged for CFOs is routinely being consumed by end users, that divergence is the insight. Either the asset is mistagged, or its content is appealing to the wrong audience and failing to reach the one it was designed for.
Content platforms that integrate with CRM data can automatically attribute engagement events to contact roles, giving you the contact-level layer without manual entry or import work. This is the configuration that makes persona comparison possible at scale.
The Most Common Tagging Mistake
Teams tag content by what it contains rather than who it's for. A competitive comparison is a content type. It can be designed for an economic buyer, a technical evaluator, or a champion, and each version will look different and perform differently. Without the persona tag, the competitive comparison reads as a single unit in your analytics when it's actually three different jobs being done by three different assets.
Content Hub Operations: Strategies for Managing Effectively covers how a well-governed content hub makes consistent tagging sustainable rather than a one-time project.
Step Two: Choosing the Right Metrics for Each Persona Type
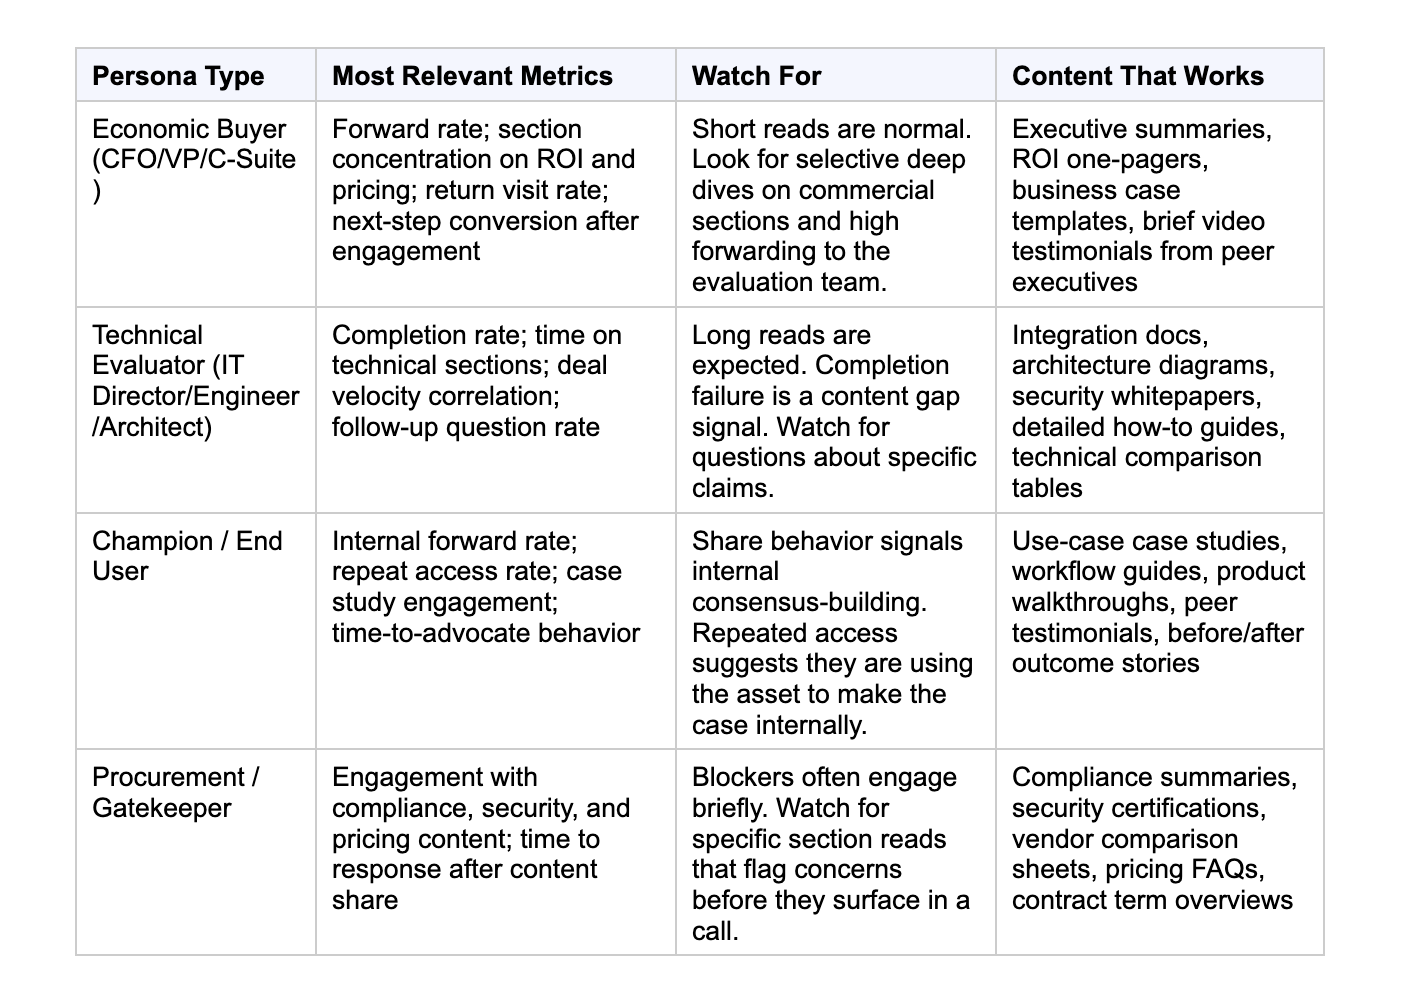
The right metrics for content performance by persona differ by buyer type. Economic buyers: measure forward rate, section concentration on commercial sections, and return visit rate. Technical evaluators: measure completion rate, time on technical sections, and deal velocity correlation. Champions and end users: measure internal forward rate, repeat access, and case study engagement. Gatekeepers: measure engagement with compliance and pricing content and time-to-response after share.
A practitioner who reads a technical integration guide for 12 minutes is showing deep engagement. A CFO who reads the same guide for 12 minutes is probably confused, not converting. Time-on-page is a positive signal for one persona and a negative signal for the other. Aggregate metrics flatten this context. Persona-level metrics preserve it.
Here is what to measure, and why it matters, for each primary buyer persona.
Economic Buyers (CFOs, VPs, C-Suite)
Economic buyers are deciding whether the investment is justified. They skim more than they read, they delegate evaluation to their teams, and they concentrate attention on the specific sections that answer their single question: is this worth the money? Their content engagement is typically shorter, higher in forwarding frequency, and concentrated on specific commercial sections.
- Forward rate: Are they passing the content to their evaluation team? High forward rate from an economic buyer is a buying signal, not a performance failure. If they're skimming and forwarding, the content is doing its job.
- Section concentration on commercial sections: Did they spend meaningful time on the ROI summary, pricing section, or executive summary specifically? This is the section-level engagement signal that tells you whether the economic argument landed.
- Return visit rate: Did they come back? An economic buyer who returns to a document without being prompted is actively evaluating, not passively browsing.
- Conversion to meeting or demo request: What percentage of economic buyer content engagements result in a next-step action? This is the ultimate outcome signal for this persona.
Technical Evaluators (IT Directors, Engineers, Architects)
Technical evaluators are assessing feasibility, integration complexity, and risk. Their engagement pattern is the inverse of economic buyers: they read sequentially, they go deep, and they finish what they start. An incomplete read from a technical evaluator is a signal that the content hit a question or concern it didn't address.
- Completion rate: Did they reach the end of the document? Technical evaluators who don't finish have hit an unanswered question. The section where they stopped is where the content gap is.
- Time on technical sections: Are they spending time on the integration, security, or architecture sections specifically? Deep time on these sections is positive; time skewing toward the pricing section suggests the technical case hasn't been made yet.
- Deal velocity correlation: Do deals that include a technical evaluator who engaged deeply with a specific asset close faster than those where the evaluator didn't engage? This is the strongest signal that a content asset is genuinely accelerating the technical evaluation.
Champions and End-User Buyers
Champions are your internal advocates. End users are evaluating whether the product fits their daily workflow. Both are trying to answer a version of the same question: will this actually work for us? Content for both should be specific to their role, grounded in real use cases, and easy to share with others at their organization.
- Internal forward rate: Champions build consensus by sharing your content internally. High internal forwarding from a champion contact is a committee-building signal, not just a content performance metric.
- Repeat access rate: Do they come back to the same asset multiple times? Repeated access suggests they are using it as evidence in an internal conversation, not just reading it once for their own evaluation.
- Case study and testimonial engagement: Social proof and peer evidence land differently for this persona than for economic buyers. Which case study format, peer testimonials, outcome metrics, before/after stories, drives the most engagement with champions specifically?
See 13 Most Important Types of Sales Enablement Content for a breakdown of which content formats serve each persona and stage most effectively.
Procurement and Gatekeepers
Gatekeepers are evaluating risk, not value. They engage with the content that confirms the vendor is safe to choose: compliance documentation, security certifications, pricing terms, and vendor comparison sheets. Their engagement is typically brief and concentrated on specific sections. A gatekeeper who spends five minutes on a security whitepaper is showing a level of engagement that should trigger a targeted follow-up.
Here is the full persona-metrics comparison:
Step Three: Running the Comparison Analysis
To compare content engagement across buyer types, pull engagement data segmented by contact role, calculate persona-specific rates (forward rate, completion rate, return visit rate) for each asset separately, and cross-reference with deal outcomes. The resulting persona-performance matrix shows which content formats work for which audiences and where the gaps are.
Measurement without structure produces confusion. The persona-performance matrix is the framework that turns raw engagement data into specific content decisions.
The Persona-Performance Matrix
The persona-performance matrix is a table that maps your content asset types against your primary buyer personas, with performance indicators in each cell. It answers the question a content strategist or enablement manager needs answered before every planning cycle: which formats work for which audiences, and where are the gaps?
Build it in three steps:
- Pull engagement data segmented by contact role. Export or filter your content analytics platform to show engagement metrics broken down by the contact's role (from your CRM). Filter to deals that progressed past a meaningful stage to separate active evaluation from passive consumption.
- Calculate persona-specific rates. For each asset, calculate the forward rate, completion rate, and return visit rate separately for each persona type. Do not average them. The variance between persona types is the insight. A case study with a 40% forward rate from champions and a 5% forward rate from economic buyers is telling you something specific.
- Cross-reference with deal outcomes. Map assets to deal stage at the time of engagement. Which assets appear most often in closed-won deals, broken down by which persona type was engaging? This is the attribution signal that separates content that generates engagement from content that generates revenue.
What the Comparison Typically Reveals
Three findings emerge from this analysis in almost every team that runs it, along with their implications.
- Finding 1: Assets rated high in aggregate are often doing heavy lifting for one persona and nothing for another. A case study with strong average engagement may be exclusively resonating with champions and generating zero engagement with economic buyers. The response: create a version of the same case study with an executive summary and ROI framing, tagged specifically for economic buyers. Same story, different angle, different audience.
- Finding 2: Your technically weakest content often performs best with gatekeepers. Simple, visual, low-jargon content that doesn't rank well in engagement metrics often handles objections from procurement contacts more effectively than detailed technical assets. These assets rarely get built because they look unimpressive in aggregate. The persona view reveals they're doing important work.
- Finding 3: Gaps in the matrix are content briefs waiting to be written. If a specific persona type has no well-performing asset at a specific deal stage, that's a documented content gap with clear business justification for filling it. The matrix converts content roadmap prioritization from a creative preference exercise into a data-backed investment decision.
Why Sales Reps Overlook Marketing Content and How to Fix It covers the downstream consequences when persona gaps go unfilled and reps reach for what they have rather than what they need.
Step Four: Closing the Loop: Feeding Persona Insights Back to Content Strategy
Analysis without action is just reporting. The persona-performance matrix only creates value when it changes what gets built next. Here are the three specific decisions it should drive.
Decision 1: Which Assets to Update, Split, or Retire
An asset that performs well across multiple persona types should be maintained and refreshed regularly. It's doing broad work. An asset that performs well for only one persona should be kept and labeled clearly for that use case, or used as the basis for persona-specific variants. A case study that lands with champions but not with economic buyers doesn't need to be replaced; it needs an executive-summary version.
An asset that performs poorly for all persona types is a retirement candidate. Not because it was poorly made, but because it's not serving any audience well enough to justify the space it occupies in the library and the reps' search results.
Decision 2: Which Persona Gaps to Prioritize in the Content Roadmap
When the persona-performance matrix shows a blank cell (no effective content for a specific persona at a specific stage), that gap should be prioritized ahead of creating a fifth case study for a persona that's already well-served. The content roadmap becomes defensible to leadership when it's grounded in documented gaps rather than creative preference.
82% of top B2B marketers attribute their success to understanding their audience extremely well. The teams that act on that understanding don't just know who their personas are; they know where their content library is failing those personas and can name the specific gap they're filling with every new asset they brief.
Decision 3: Which Persona Insights to Share with Sales
Persona performance data is not just a marketing tool. When marketing knows that technical evaluators engage with integration content but rarely forward it, that's a specific signal for sales: the technical evaluator hasn't become a champion yet. A targeted follow-up addressing their specific technical concerns is the right next move, not a generic check-in.
When champions are repeatedly accessing the same case study, sales can follow up to reinforce that argument rather than introducing new information the champion has to process and re-present internally. The content data changes what reps say in their follow-ups when it reaches them in a usable format at the right moment.
The Feedback Cadence That Makes This Sustainable
A monthly persona performance review covering the top ten most-shared assets, segmented by persona type, produces more actionable insight than a quarterly content audit covering everything. Monthly cadence keeps the feedback loop tight enough that content decisions respond to actual deal data rather than quarterly averages. Review against deal outcomes from the prior month, not just engagement metrics, to keep the analysis grounded in revenue impact.
Content Hub Operations: Strategies for Managing Effectively covers the operational infrastructure that makes this feedback cadence sustainable at scale.
How Paperflite Enables Persona-Level Content Performance Comparison
The four steps above describe the analysis in platform-agnostic terms. Here is how Paperflite handles each one in practice, based on verified feature descriptions from Capterra, Gartner Peer Insights, GetApp, and Paperflite's own product pages.
Content analytics beyond aggregate views. Paperflite's Content Analytics engine provides real-time engagement metrics per shared asset: views, time-on-content, section-level reads, forward events, and return visits. These metrics can be filtered by the contact's CRM role, giving marketing a persona-level view of how specific asset types are performing with specific buyer types rather than a single average across all contacts. Users describe it as being able to 'understand how content has been consumed by prospects, based on interactions and engagement.'
Multi-recipient tracking surfaces which personas are actually in the deal. Paperflite's multi-recipient tracking technology detects when shared content is forwarded internally, identifying new contacts and their roles at the account. When a proposal forwarded by a champion reaches a CFO and a procurement contact, those new contacts are flagged in the deal record with their own engagement data. The persona breakdown of a deal's content engagement becomes visible automatically, not through manual CRM updates.
Content organized by persona for rep-level discoverability. Paperflite's content library supports persona-tagged organization, letting reps filter by buyer type to find the most relevant asset for the specific stakeholder they're speaking with. Combined with SEEK, Paperflite's AI-powered search that indexes across more than 30 content attributes, a rep can find the right asset for a CFO in a FinTech closing-stage deal without navigating a folder hierarchy or remembering exact file names.
Content Revenue Intelligence connects persona engagement to deal outcomes. Paperflite's Content Revenue Intelligence links asset-level engagement data to pipeline and closed-won outcomes, providing the deal-attribution signal needed to understand which assets for which personas are actually driving revenue. This is the output that turns persona performance comparison from a reporting exercise into a content investment decision.
Pricing
Paperflite pricing starts at $30 per user per month (the 'I Got Wings' plan, minimum 5 users), with the entry point post-trial at $150/month for a 5-user team. The Professional plan ('I Believe I Can Fly') runs $50/user/month, adding CRM integrations (Salesforce, HubSpot, Pipedrive, Freshsales, Microsoft Dynamics), white labeling, SSO, and a dedicated Customer Success Manager. The Advanced plan ('Touch The Sky') is $60/user/month, adding digital deal rooms and deeper AI-powered content recommendations. Enterprise pricing requires a custom quote.
See also: 7 Key Benefits of Sales Enablement You Can't Afford to Miss for the broader revenue case for making content analytics a core sales enablement function.
See how Paperflite surfaces content performance by persona across your deal pipeline. [Book a demo]
For the next layer down on managing the content that feeds this analysis: Sales Content Management Guide.
Conclusion
Comparing content performance by persona is not a reporting exercise. It's a content strategy function. When you know that technical evaluators complete your integration guides at high rates but rarely forward them, you know the asset is technically working but isn't being mobilized as an internal selling tool. When you know your CFO-targeted case studies generate high forward rates but low engagement on the ROI summary, you know the executive framing needs work. Those are specific, actionable decisions. Aggregate metrics don't produce them. Persona-level analysis does.
The teams that get this right don't have more content than everyone else. They have content that works harder for fewer personas, built from documented gaps rather than creative preference, and measured against deal outcomes rather than page views.
For the next step in building the library, this analysis requires: Organize B2B Marketing Content in 8 Simple Steps. And for how persona analytics fits within a broader enablement strategy: How to Build a Sales Enablement Strategy.
Ready to compare how your content is actually performing across different buyer types? [Start your free Paperflite trial]
Frequently Asked Questions
What does comparing content performance by persona mean?
It means segmenting your content analytics by buyer type, such as economic buyer, technical evaluator, champion, or gatekeeper, so you can see how each audience engages with specific assets rather than averaging engagement across all viewers. The resulting view reveals which content resonates with which buyer types, where gaps exist in your content library for specific personas, and which assets appear most often in deals where specific stakeholder types are involved.
Why does measuring content performance by persona matter for B2B sales?
B2B buying groups typically involve six to ten stakeholders, each with different information needs and content preferences. Content that works for a technical evaluator often fails with an economic buyer, and vice versa. Aggregate content performance metrics mask this variance. Persona-level measurement surfaces which assets actually advance deals for each buyer type, enabling more targeted content creation and more precise sales follow-up behavior.
What metrics should I track for content performance by persona?
The most useful metrics differ by persona. For economic buyers, track forward rate, section concentration on commercial sections, and return visit rate. For technical evaluators, track completion rate, time on technical sections, and deal velocity correlation. For champions and end users, track internal forward rate, repeat access, and case study engagement. For gatekeepers, track engagement with compliance and pricing content and time-to-response after a content share.
How do I tag content for persona-based analysis?
Build a three-dimensional tagging taxonomy before adding content to your library: primary persona target (who the asset is designed for), funnel stage (awareness, consideration, decision), and vertical fit (general or industry-specific). Apply tags consistently before assets enter the library. Track contact-level engagement data separately to see whether the actual audience matches the intended one. When the two diverge consistently, that divergence is an insight about misalignment between content design and real usage.
What is a persona-performance matrix and how do I build one?
A persona-performance matrix is a table that maps your content asset types against your primary buyer personas, with performance indicators in each cell. Build it by pulling engagement data segmented by contact role, calculating persona-specific rates (forward rate, completion rate, return visit rate) for each asset type, and cross-referencing with deal outcomes. The blank cells in the matrix are content gaps with clear business justification for filling them.
How does persona content performance data connect to sales strategy?
When marketing knows that technical evaluators engage with integration content but rarely forward it, that is a signal for sales: the technical evaluator hasn't become a champion yet and a targeted follow-up addressing their specific technical concerns is the right next move. When champions are repeatedly accessing the same case study, sales can reinforce that argument rather than introducing new information. Persona performance data changes the timing and content of rep follow-ups when it reaches reps in a usable format at the right moment.
What tools support persona-based content performance comparison?
Useful tools include: Google Analytics with audience segmentation for web content performance; HubSpot's content analytics with CRM-linked contact roles; Marketo with persona-tagged campaign reporting; and sales content platforms like Paperflite, which track post-share engagement (views, forwards, section reads) at the contact role level across deals, connecting content consumption to deal stage and outcome. The key capability to look for is the ability to filter content analytics by the consuming contact's role, not just by the asset's own persona tag.
How often should I review content performance by persona?
A monthly review of your top ten most-shared assets, segmented by persona type, produces more actionable insight than a quarterly audit covering everything. Monthly cadence keeps the feedback loop tight enough that content decisions respond to actual deal data rather than quarterly averages. Always review against deal outcomes from the prior month, not just engagement metrics, to keep the analysis grounded in revenue impact rather than content vanity metrics.